This is the first data they have presented since announcing their project 8 months ago. They have taken a lot of flak from DC Rainmaker (properly in our view) for making bold claims without any supporting data.
Their graph title (proudly?) says "LIMITS vs SRM Power 0.94 correlation coefficient". We'll assume their statisticians are correct.
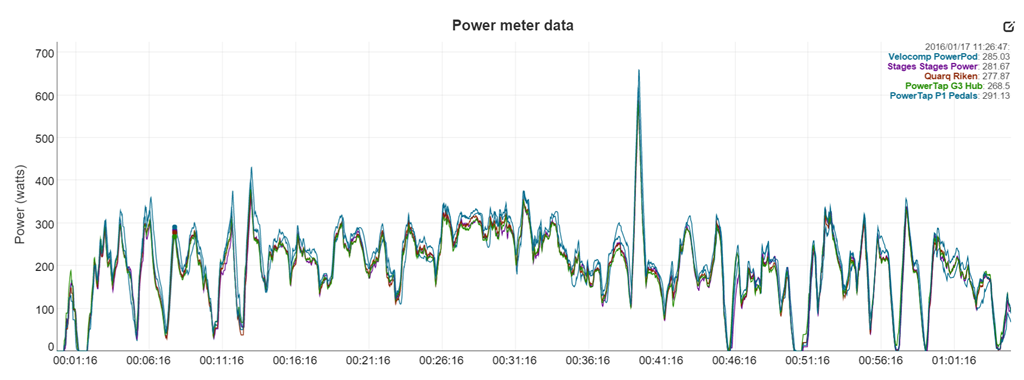
But we're cyclists, not statistics majors, so we looked at the data from a cyclist's point of view...
The ride shown is about 9 ½ minutes long...in our view not long enough to prove anything.
For the first "long" interval, seconds 51 to 101, the Limits reads 20% low (200 vs 250W). NOTE: all of this analysis is by eyeball, so exact results may differ slightly.
The first surge, at second 115, Limits is 29% low (250 vs 350).
The second long interval, 126 to 226 seconds, the Limits is about 19% low, about 40W less than the SRM.
The second surge, at 276 seconds, the Limits is 37% low (300 vs 480)
The third interval, 276 to 326 seconds, Limits is consistently low, and completely misses the SRM surge at second 320.
Starting at second 360, Limits again misses the surge by 23% low (290 vs 375)
Good news: when the cyclist backs off on power, between 376 and 426 the two devices are close.
But in the final seconds of the short ride (426 to 576) , where there are six surges of power, Limits is 58% low on one burst at second 476, and 56% low at second 501.
We honestly don't know many power meter users who would accept this quality of performance, and even fewer who could figure out how to benefit from it.
Based on our cycling-oriented view of power and the data presented here's a title for their graph that we'd suggest: "LIMITS vs SRM Power: consistently low performance"